文章内容
2018/8/28 15:31:10,作 者: 黄兵
How Not To Sort By Average Rating
By Evan Miller
February 6, 2009 (Changes)
Translations: Russian Ukrainian Estonian
PROBLEM: You are a web programmer. You have users. Your users rate stuff on your site. You want to put the highest-rated stuff at the top and lowest-rated at the bottom. You need some sort of “score” to sort by.
WRONG SOLUTION #1: Score = (Positive ratings) − (Negative ratings)
Why it is wrong: Suppose one item has 600 positive ratings and 400 negative ratings: 60% positive. Suppose item two has 5,500 positive ratings and 4,500 negative ratings: 55% positive. This algorithm puts item two (score = 1000, but only 55% positive) above item one (score = 200, and 60% positive). WRONG.
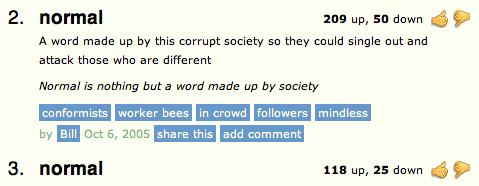
Sites that make this mistake: Urban Dictionary
WRONG SOLUTION #2: Score = Average rating = (Positive ratings) / (Total ratings)
Why it is wrong: Average rating works fine if you always have a ton of ratings, but suppose item 1 has 2 positive ratings and 0 negative ratings. Suppose item 2 has 100 positive ratings and 1 negative rating. This algorithm puts item two (tons of positive ratings) below item one (very few positive ratings). WRONG.
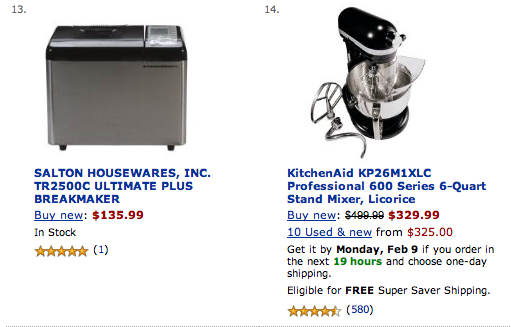
Sites that make this mistake: Amazon.com
CORRECT SOLUTION: Score = Lower bound of Wilson score confidence interval for a Bernoulli parameter
Say what: We need to balance the proportion of positive ratings with the uncertainty of a small number of observations. Fortunately, the math for this was worked out in 1927 by Edwin B. Wilson. What we want to ask is: Given the ratings I have, there is a 95% chance that the “real” fraction of positive ratings is at least what? Wilson gives the answer. Considering only positive and negative ratings (i.e. not a 5-star scale), the lower bound on the proportion of positive ratings is given by:
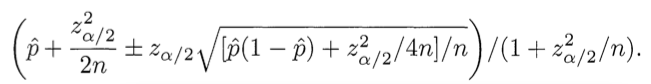
(Use minus where it says plus/minus to calculate the lower bound.) Here p̂ is the observed fraction of positive ratings, zα/2 is the (1-α/2) quantile of the standard normal distribution, and n is the total number of ratings. The same formula implemented in Ruby:
require 'statistics2'

def ci_lower_bound(pos, n, confidence)
    if n == 0
        return 0
    end
    z = Statistics2.pnormaldist(1-(1-confidence)/2)
    phat = 1.0*pos/n
    (phat + z*z/(2*n) - z * Math.sqrt((phat*(1-phat)+z*z/(4*n))/n))/(1+z*z/n)
end
pos is the number of positive ratings, n is the total number of ratings, and confidence refers to the statistical confidence level: pick 0.95 to have a 95% chance that your lower bound is correct, 0.975 to have a 97.5% chance, etc. The z-score in this function never changes, so if you don’t have a statistics package handy or if performance is an issue you can always hard-code a value here for z. (Use 1.96 for a confidence level of 0.95.)
UPDATE, April 2012: Here is an illustrative SQL statement that will do the trick, assuming you have a widgets table with positive and negative ratings, and you want to sort them on the lower bound of a 95% confidence interval:
SELECT widget_id, ((positive + 1.9208) / (positive + negative) -
                   1.96 * SQRT((positive * negative) / (positive + negative) + 0.9604) /
                          (positive + negative)) / (1 + 3.8416 / (positive + negative))
       AS ci_lower_bound FROM widgets WHERE positive + negative > 0
       ORDER BY ci_lower_bound DESC;
If your boss doesn’t believe that such a complicated SQL statement could possibly return a useful result, just compare the results to the other two method described above:
SELECT widget_id, (positive - negative)
       AS net_positive_ratings FROM widgets ORDER BY net_positive_ratings DESC;

SELECT widget_id, positive / (positive + negative)
       AS average_rating FROM widgets ORDER BY average_rating DESC;
You will quickly see that the extra bit of math makes all the good stuff bubble up to the top. (But before running this SQL on a massive database, talk to your friendly neighborhood database administrator about proper use of indexes.)
UPDATE, March 2016: Here’s the same formula in Excel:
=IFERROR((([@[Up Votes]] + 1.9208) / ([@[Up Votes]] + [@[Down Votes]]) - 1.96 *
    SQRT(([@[Up Votes]] *  [@[Down Votes]]) / ([@[Up Votes]] +  [@[Down Votes]]) + 0.9604) /
    ([@[Up Votes]] +  [@[Down Votes]])) / (1 + 3.8416 / ([@[Up Votes]] +  [@[Down Votes]])),0)
I initially devised this method for a Chuck Norris-style fact generator to honor of one of my professors, but it has since caught on at places like Reddit, Yelp, and Digg.
OTHER APPLICATIONS
The Wilson score confidence interval isn’t just for sorting, of course. It is useful whenever you want to know with confidence what percentage of people took some sort of action. For example, it could be used to:
- Detect spam/abuse: What percentage of people who see this item will mark it as spam?
- Create a “best of” list: What percentage of people who see this item will mark it as “best of”?
- Create a “Most emailed” list: What percentage of people who see this page will click “Email”?
Indeed, it may be more useful in a “top rated” list to display those items with the highest number of positive ratings per page view, download, or purchase, rather than positive ratings per rating. Many people who find something mediocre will not bother to rate it at all; the act of viewing or purchasing something and declining to rate it contains useful information about that item’s quality.
CHANGES
- Apr. 20, 2016: Added Excel implementation (thanks to Alessandro Apolloni)
- Apr. 4, 2012: New SQL implementation
- Nov. 13, 2011: Fixed statistical confidence language and altered code example accordingly
- Feb. 15: Clarified the statistical power example
- Feb. 13 II: “Other applications”
- Feb. 13: General clarification, plus a link to the relevant Wikipedia article.
- Feb. 12, 2009: The example in “Wrong Solution #1” was erroneous. It has been fixed.
REFERENCES
Binomial proportion confidence interval (Wikipedia)
Agresti, Alan and Brent A. Coull (1998), “Approximate is Better than ‘Exact’ for Interval Estimation of Binomial Proportions,” The American Statistician, 52, 119-126.
Wilson, E. B. (1927), “Probable Inference, the Law of Succession, and Statistical Inference,” Journal of the American Statistical Association, 22, 209-212.
You’re reading evanmiller.org, a random collection of math, tech, and musings. If you liked this you might also enjoy:
- Rank Hotness With Newton’s Law of Cooling
- How To Read an Unlabeled Sales Chart
- Bayesian Average Ratings
- Ranking Items With Star Ratings: An Approximate Bayesian Approach
Get new articles as they’re published, via Twitter or RSS.
Want to look for statistical patterns in your MySQL, PostgreSQL, or SQLite database? My desktop statistics software Wizard can help you analyze more data in less timeand communicate discoveries visually without spending days struggling with pointless command syntax. Check it out!
评论列表